Mapping the Immune Landscape of Lung Cancer with Xenium Spatial Transcriptomics
Self-directed analysis of a public 10x Genomics dataset, conducted independently of my dissertation research.
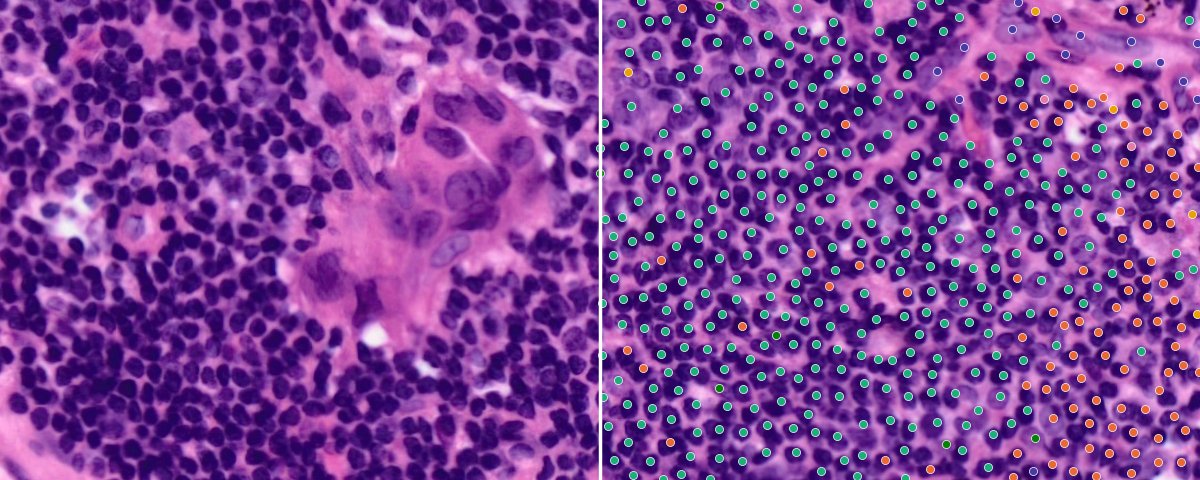
Tertiary lymphoid structure on the H&E (left), with Xenium cells coloured by lineage (right).
Where are immune cells located within a lung tumour, and which findings hold up under critical evaluation?
I analysed a public 10x Genomics Xenium lung cancer dataset end to end at single-cell resolution. Starting from the raw instrument output, the workflow covers transcript- and cell-level quality control, re-segmentation, cell-type annotation validated against a reference atlas, H&E image alignment, spatial graph construction, neighbourhood and niche analysis, tissue-domain mapping, ligand-receptor cell-cell communication and spatial differential expression, with the key results re-tested for segmentation artefacts.
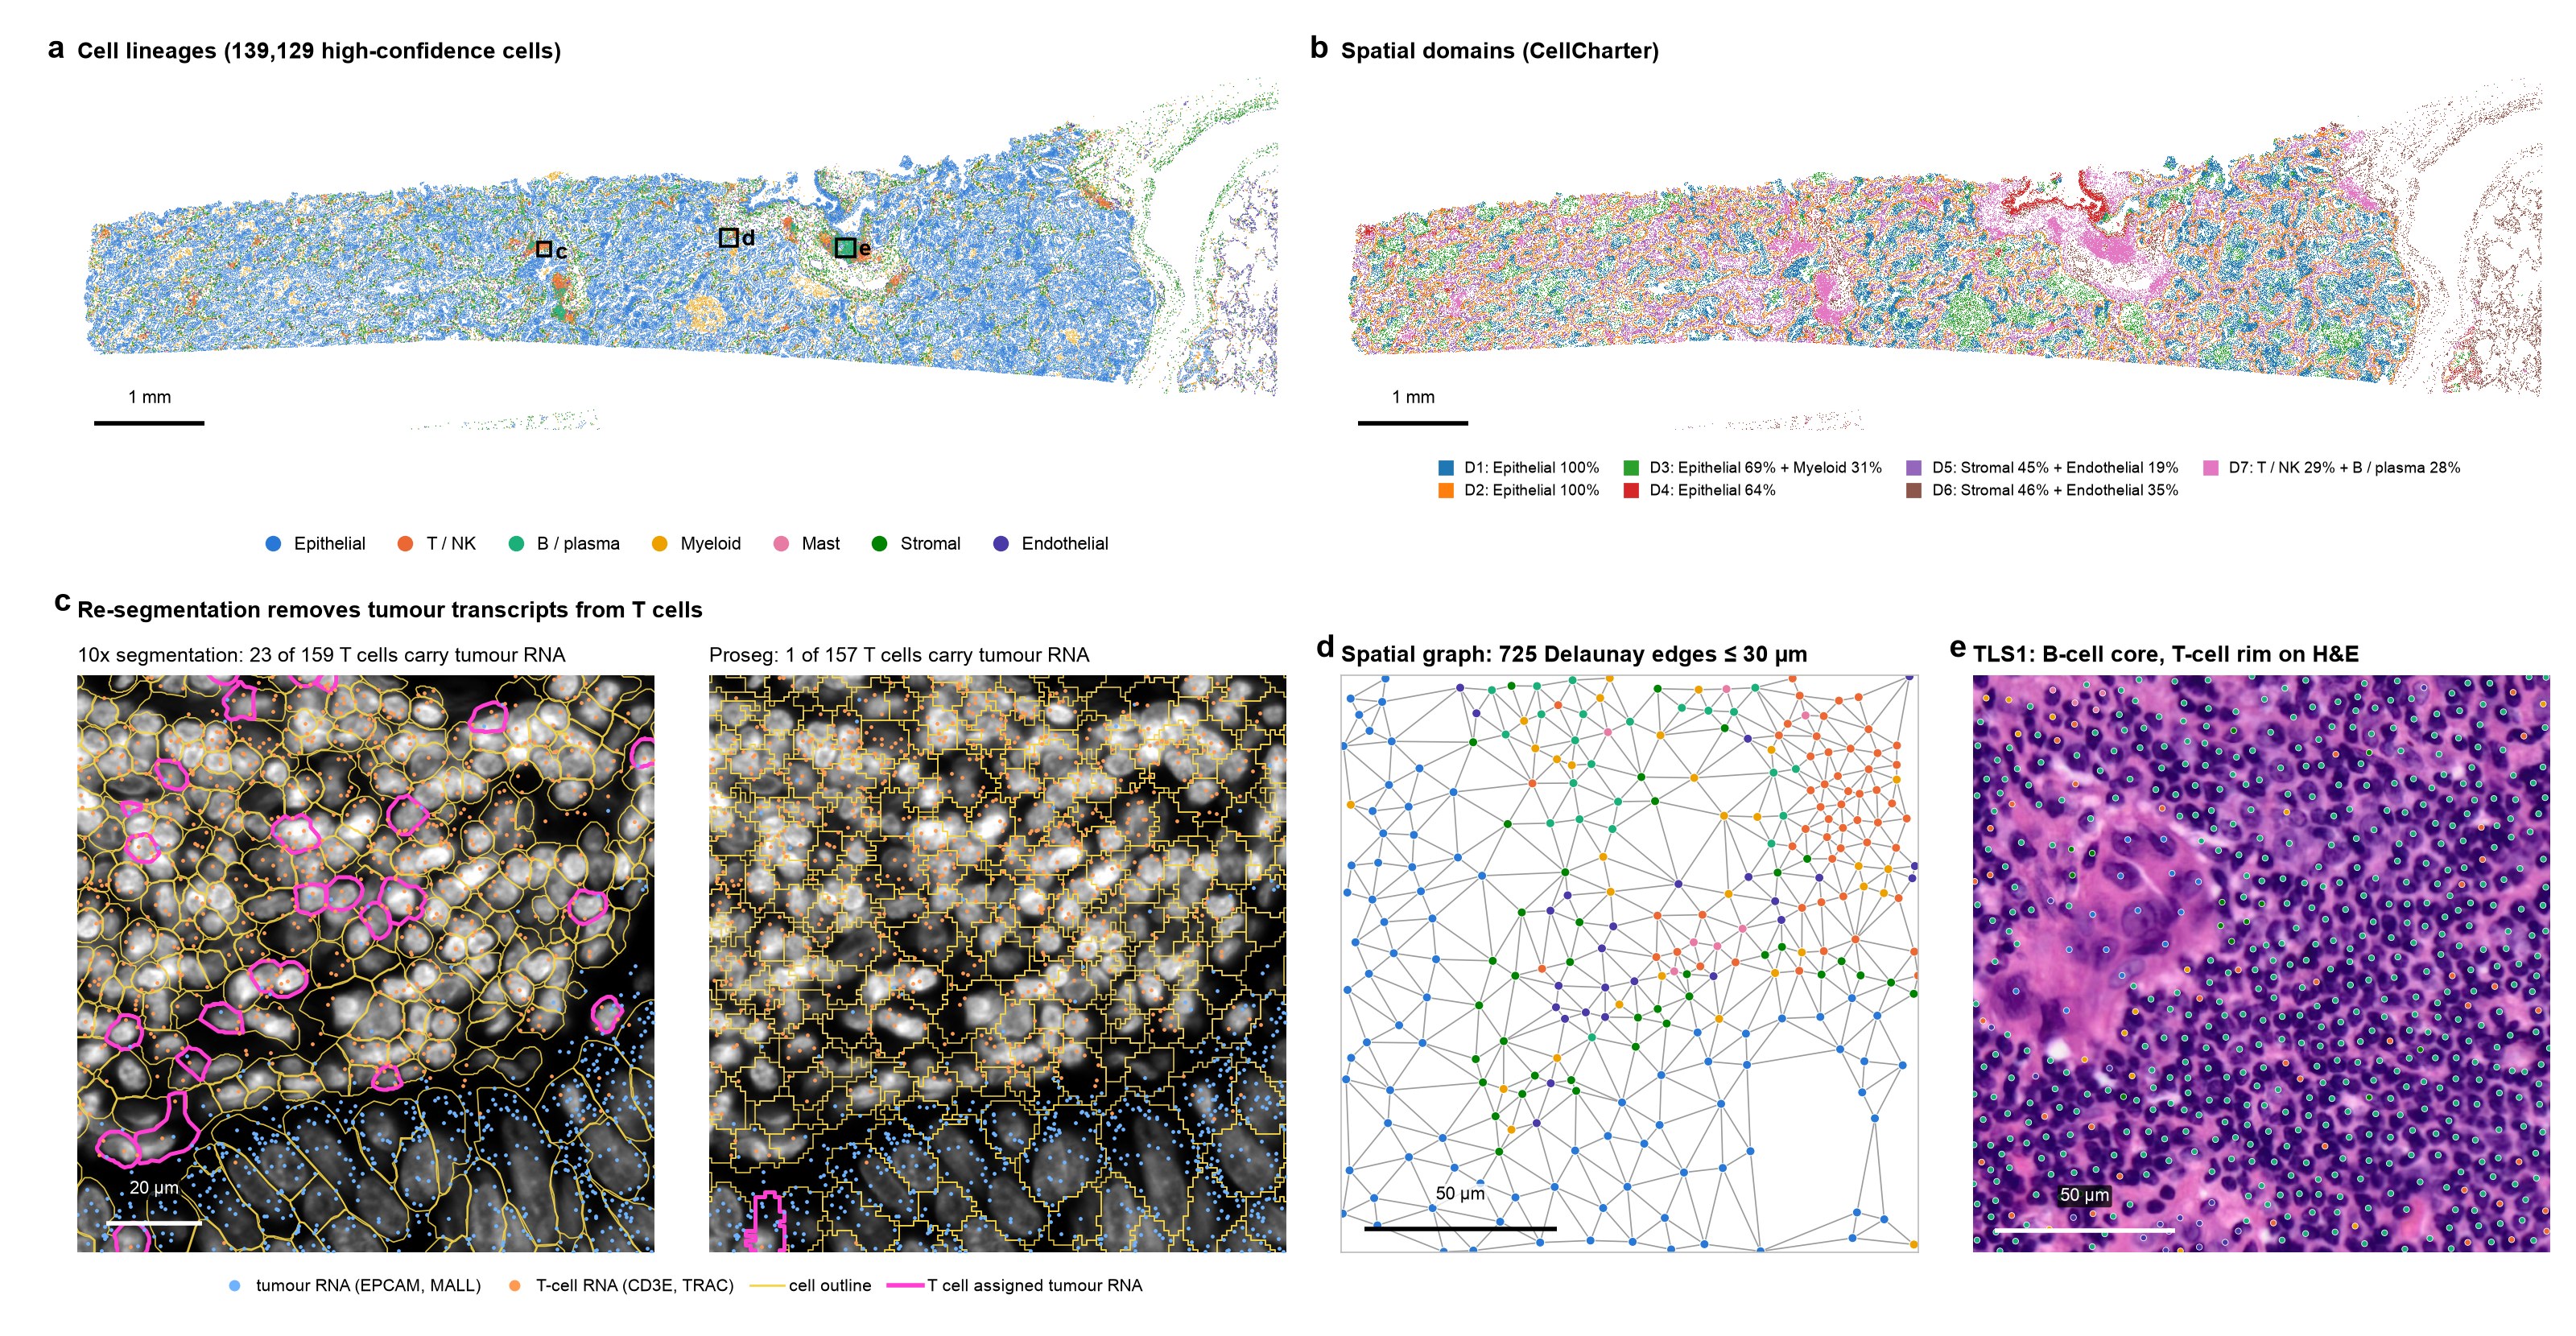
Figure 1. Spatial organisation and analysis workflow of a lung adenocarcinoma section.
- aSpatial distribution of 139,129 high-confidence cells, coloured by lineage. Boxes indicate the regions shown in panels c–e. Scale bar, 1 mm.
- bSpatial domains identified using CellCharter. Scale bar, 1 mm.
- cVendor (10x, left) and Proseg (right) cell segmentations overlaid on DAPI at a tumour–T-cell interface (120 × 120 µm), selected for the densest overlap of tumour and T-cell transcripts. Magenta outlines identify T cells assigned epithelial transcripts (EPCAM or MALL): 23 of 159 cells with 10x versus 1 of 157 with Proseg. Across the section, the corresponding proportions were 18.8% and 1.5% of T / NK cells. Proseg cells inherit lineage annotations from their matched 10x cells. Scale bar, 20 µm.
- dDelaunay spatial neighbourhood graph, restricted to edges ≤30 µm, at a tumour–stroma–immune interface (150 × 150 µm). Scale bar, 50 µm.
- eTLS-like aggregate TLS1 on matched H&E (160 × 160 µm), with Xenium cell centroids coloured by lineage. Scale bar, 50 µm.
Lineage colours are consistent across panels a and c–e.
Dataset
Xenium In Situ: Human Lung Cancer (FFPE) ↗
A publicly available 10x Genomics dataset profiling an adult human lung adenocarcinoma section, released under the CC BY 4.0 licence.
- Tissue:
- Formalin-fixed, paraffin-embedded (FFPE) lung adenocarcinoma from one donor.
- Gene panel:
- Xenium Human Multi-Tissue and Cancer Panel, targeting 377 genes.
- Dataset size:
- 162,254 detected cells and 10,605,483 high-quality decoded transcripts.
- Histology:
- Matched post-Xenium H&E image of the same tissue section.
- Processing:
- Preview multimodal cell segmentation dataset analysed with Xenium Onboard Analysis v2.0.0.
- Released:
- 5 February 2024, by 10x Genomics.
Reference atlas
Cell-type annotations were assessed against the Lung Cancer Atlas (LuCA; approximately 892,000 cells from 298 donors; Salcher et al., Cancer Cell, 2022). Read the paper.
What I Did
01
Data processing and quality control
Filtered transcripts at Q20 and removed negative-control probes and codewords. Applied cell-level quality control using transcript counts, detected gene counts, cell-area outliers based on median absolute deviation (MAD), and negative-control fractions. Imaging-tile checks localised low-quality cells to a lower tissue fragment and the tissue edge. Retained 154,394 of 162,254 cells.
02
Segmentation assessment and re-segmentation
Quantified transcript spillover between neighbouring cells in the 10x multimodal segmentation. Re-segmented all 10.6 million transcripts using Proseg, a probabilistic transcript-based method, and re-tested the key findings on the re-segmented cells.
03
Clustering and cell-type annotation
Performed normalisation, PCA, Leiden clustering, and marker-based annotation, followed by lineage-level subclustering to resolve 33 cell types. Assessed annotations through label transfer from the Lung Cancer Atlas (LuCA), with 92% lineage agreement for high-confidence cells, and complementary SingleR annotation in R.
04
Image alignment
Registered the matched H&E image to Xenium coordinates using the 10x affine transform. Assessed alignment quantitatively through hematoxylin–DAPI correlation, which peaked within one 4 µm grid step of zero shift, and visually in selected regions.
05
Spatial graph and neighbourhood analysis
Constructed a Delaunay cell-neighbourhood graph, removing edges longer than 30 µm. Assessed neighbourhood enrichment using permutation tests, alongside cell-type co-occurrence, Ripley’s L, and graph centrality. Evaluated spatially variable gene expression using Moran’s I.
06
Tissue microenvironment mapping
Mapped cellular niches from local lineage composition and identified spatial domains using BANKSY and CellCharter. Quantified immune infiltration relative to tumour-cell distance, detected TLS-like aggregates using DBSCAN, and classified tumour regions (400 µm tiles) as inflamed, immune-excluded, or immune-desert.
07
Cell–cell communication analysis
Analysed ligand–receptor interactions using squidpy with OmniPath and CellChat v2. Applied a contact-based permutation test that shuffled expression within cell types to assess contact-associated ligand–receptor enrichment beyond differences in cell abundance.
08
Spatial differential expression
Compared CD8+ T-cell states across tissue compartments and performed paired pseudobulk DESeq2 analysis of the same macrophage population across spatial domains. Filtered genes with signals attributable to transcript spillover from neighbouring cells.
09
Histology foundation model analysis
Extracted Phikon-v2 embeddings from cell-centred H&E patches to evaluate prediction of cell types, gene expression, and spatial domains from morphology alone. Assessed cell-type and gene-expression predictions using spatially blocked cross-validation.
10
Reproducibility and interactive exploration
Implemented a reproducible Snakemake workflow backed by a tested Python package with continuous integration. Cross-checked results through an R / Bioconductor replication and provided an interactive Vitessce viewer for exploring cells in their spatial context.
Key Findings
Tumour regions show a predominantly CD8-excluded pattern
Only 12% of GZMK+ CD8 T cells were within 15 µm of a tumour cell, compared with 34% of non-tumour cells overall. Of the 119 tumour-containing 400 µm tiles scored, 65% were classified as immune-excluded, 26% as immune-desert, and 9% as inflamed under default thresholds; excluded remained the most frequent label across all nine threshold settings tested.
Myeloid and stromal cells lay closer to tumour cells: 68% of alveolar macrophages, 55% of cDC2 cells, and 50% of fibroblasts were within 15 µm of a tumour cell. Together, these findings support a predominantly CD8-excluded spatial pattern in this tissue section, defined operationally by centroid distances and density thresholds.
TLS-like aggregates show spatial differences in CD8+ T-cell state
Six tertiary lymphoid structure (TLS)-like aggregates contained 71% of B cells. Each combined B cells with T / NK cells, mregDCs and CCL19-expressing cells, with few tumour cells; the largest (TLS1) corresponds to a dense lymphoid aggregate on the matched H&E. CCR7 was detected in 36% of GZMK+ CD8 T cells within these aggregates, compared with 11% within 15 µm of tumour cells.
Graph contacts between CCL19-positive and CCR7-positive cells were 2.35-fold the expectation under a within-cell-type permutation null, indicating spatial co-occurrence rather than demonstrated signalling. The CCR7 difference persisted after re-segmentation, supporting robustness to segmentation spillover. The aggregates are termed TLS-like because TLS-maturity markers are absent from the panel.
Myeloid cells show PD-L1 expression and location-associated macrophage profiles
PD-L1 (CD274) transcripts were detected in 12–13% of CXCL9+ macrophages and LAMP3+ mature dendritic cells, compared with fewer than 1% of tumour cells.
FCGR1A+ macrophages showed higher TREM2, CTSK and LPL expression in stromal domains, and higher MARCO, MCEMP1 and CXCL2 expression in tumour-adjacent domains (paired pseudobulk DESeq2 after excluding spillover genes). These differences persisted with re-segmented counts, supporting location-associated expression differences within this section.
Main findings persist after reducing segmentation spillover
With vendor segmentation, 19% of T / NK cells contained epithelial transcripts, and 42 of 60 initially significant macrophage genes had signals attributable to neighbouring cells. Proseg re-segmentation reduced epithelial transcript contamination in T / NK cells to 1.5%, while the main findings persisted.
Lineage annotations agreed with the Lung Cancer Atlas (LuCA) for 92% of high-confidence cells, with lower agreement for T / NK cells (63%), and conventional CD4 T cells remained unresolved under both segmentations. Together, these checks support annotation consistency and robustness to segmentation spillover within this tissue section.
H&E features predict lineage better than immune states
Features from Phikon-v2, a pathology foundation model, extracted from the matched H&E predicted cell lineage with 57% balanced accuracy in spatially held-out tissue, compared with 14% chance accuracy, but showed limited ability to distinguish functional immune states.
Regional gene expression was better predicted than single-cell expression (median r = 0.52 versus 0.17). Checkpoint transcripts PD-1, PD-L1 and LAG-3 showed little predictive signal (r ≤ 0.04). These results describe one model’s performance in this section, not the general limits of histology.
Limitations. Findings describe a single tissue section from one donor profiled with a 377-gene panel. Tumour cells are identified from expression rather than copy-number analysis; proximity measures use cell centroids and do not establish physical contact or signalling; mixed-cell flags cover only the subclustered T / NK and myeloid lineages; and statistical tests treat regions within the section as replicates.
Tools and Methods
| Programming and analysis | Python, R / Bioconductor, Scanpy, Squidpy |
|---|---|
| Spatial analysis | BANKSY, CellCharter, spatial neighbourhood statistics |
| Segmentation and annotation | Proseg, LuCA reference mapping, SingleR |
| Statistical analysis | Paired pseudobulk DESeq2, spatial permutation tests |
| Histology modelling | PyTorch, Phikon-v2, spatially blocked cross-validation |
| Reproducibility | Snakemake, ist_analysis, unit testing, continuous integration |
| Interactive visualisation | Vitessce |
Collaborate on single-cell and spatial transcriptomics
I collaborate on analyses spanning quality control, cell-type annotation, spatial organisation, statistical analysis, visualisation, and biological interpretation. My focus is on analytical rigour, reproducible workflows, and connecting computational findings to meaningful biological questions, particularly in immunology and translational research.
Areas of collaboration include:
- Single-cell and spatial transcriptomics analysis
- Immune microenvironment characterisation
- Spatial neighbourhood and cell–cell interaction analysis
- Differential expression and reference-based annotation
- Reproducible pipelines and interactive data exploration
To discuss a project, share a brief description of your biological question, data platform, and the analytical support you are seeking.
Contact me at [email protected] or through the contact form.
Discuss a collaboration